

Exit Nuno, Enter Bruno
A look at Bruno Lage's time at Benfica

It seems that all anyone knows about Bruno Lage is the following:
He’s Portuguese
He had spells as an Assistant Manager in England
He then took the Benfica job and started very well, but that trailed off
He tends to favour an attacking style, possibly a 4-4-1-1 formation and looks to bring through young players.
So, I thought I’d take a look at point 3.
I’ve taken FBREF’s match log data on Benfica over four years and used a rolling six-game average.
This should give us an idea of how Bruno’s Benfica side performed over time and compares to the managers that came before and after.
So, first of all, let’s get in our heads exactly what that drop off was:

In the first 38 matches of Lage’s reign, Benfica took an unbelievable 109 points - that’s 96% of the points available - they dropped just five points during this time. And that compares very favourably with the managers before and after him. But, in the next 10 matches, they took just 10 points. And that drop off cost him his job.
But as you know, here at WolvesAnalytics Towers, points are not necessarily what we look at when evaluating managers. So let’s take a closer look, starting with the attack.

Well, here we can see an issue. But, the thing to remember here is that the drop in goals in September 2019 is only a drop because the previous numbers were exceptional. In Lage’s first 20 games, Benfica averaged 3.8th goals a game. After that, it fell to 1.9 goals a game, and in the last 10 games, that fell to 1.2 goals a game. But over the total period of 48 games, Benfica averaged 2.67 goals a game, more than under any of the three other managers.

Unfortunately, FBREF does not have expected goal numbers for the Portuguese Primeira Liga, so we will have to use shots. And interestingly, while the goals scored towards the end of Lage’s fell, the number of shots per match remained high.

Indeed, even in the awful last 10 games under Lage, where Benfica scored just 12 goals, they were still taking 15.8 shots a match. This is only marginally down on Lage’s overall figure of 16.02 shots per match. And above the 13.9 shots a game that they have managed under Jorge Jesus.
Indeed, we can see that the goals scored per shot fell quite a lot during the latter period.

Without the xG data, it’s difficult to know whether their shooting was impossibly good for an extended period, and they dropped to a more normal level. Or, whether Benfica was just a little bit unlucky towards the end of Lage’s reign. To further add to this, the save percentage of opposition goalkeepers increased significantly towards the end of Lage’s time.

During Lage’s time, they were scoring every 6.1 shots - in the big-5 leagues in Europe this season, only Bayern Munich scored at a better rate. This suggests Lage’s Benfica side ran a little hot early in his time, but then their shooting declined towards the end.
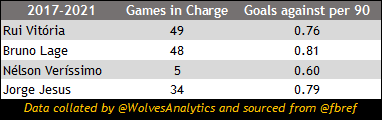
Moving towards the defence, as might be expected, Lage ran a pretty tight ship early on but started conceding goals towards the end.
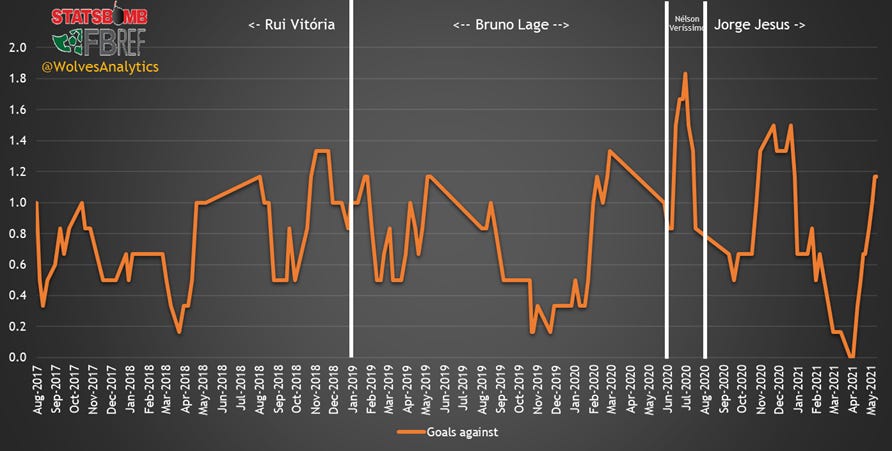
In fact, the 0.81 goals against per match were the highest of all Benfica managers over the past four seasons:
But, again, let’s look a little more detail at the shots data. Again, we can see that the shots conceded per match were actually relatively consistent throughout:

But, Benfica was conceding shots at a higher rate than under other managers:

What perhaps hurt Lage was a drop off in goalkeeper save percentage. Now, of course, this doesn’t tell us a huge amount - it could be that the goalkeeper was saving fewer shots because Benfica’s defence was horrible.
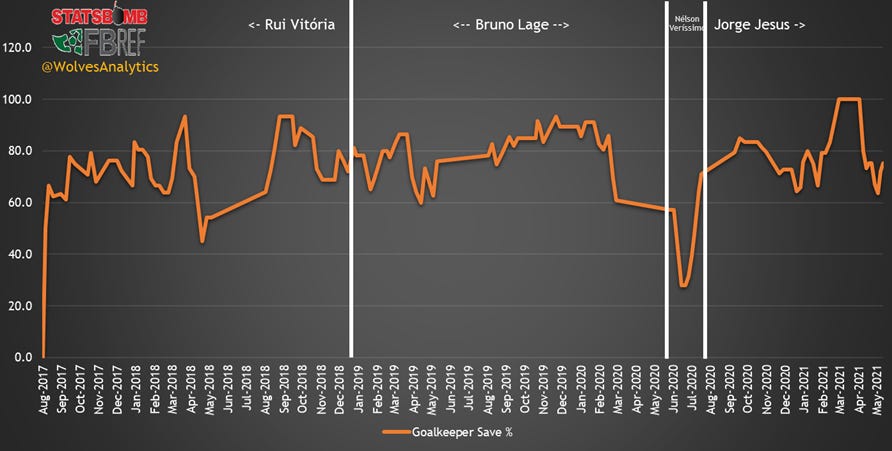
Or, it could be that they had a run where the goalkeeper let in chances that they would otherwise expect to save. During this time, the goals conceded per shot crept up:
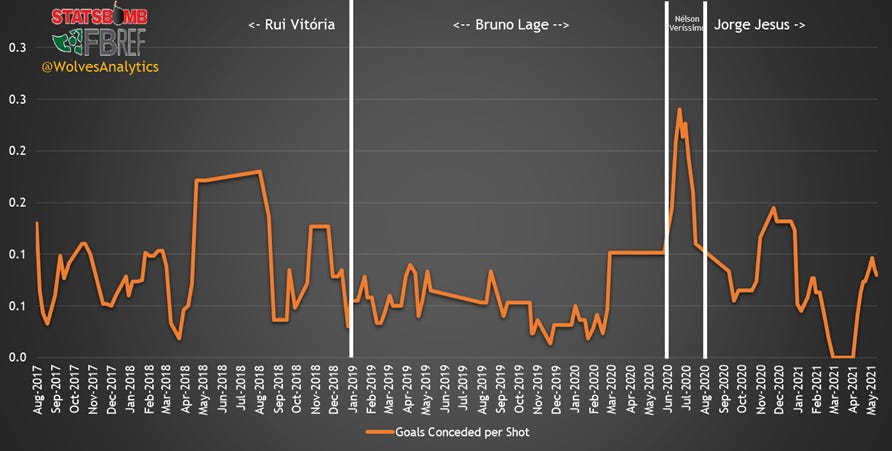
Again, it’s probably worth noting that during the glorious first 38 matches of Lage’s tenure, they conceded just 23 goals from 385 shots. A goal conceded every 16.7 shots beats any other team in Europe’s five top leagues this season. It was probably unsustainable.
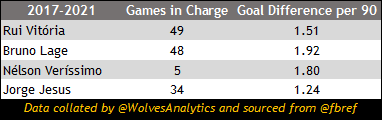
To sum up, let’s put some of this together. The goal difference was pretty good until the end:.

And it’s noticeable that this poor run at the end is not notably worse than runs by Rui Vitória and Jorge Jesus, both of whom were allowed to turn it around. Lage’s goal difference overall was exceptional:
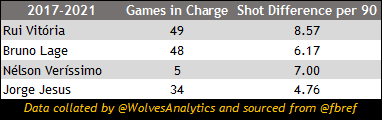
Perhaps the most worrying aspect of the dip towards the end was the shot difference:

While overall, Lage’s side averaged six shots more per match, they were being outshot towards the end. In four consecutive matches, Belenenses, Porto, Braga and Gil Vicente FC outshot Benfica 61 to 41. Benfica actually won the game against Belenenses - it was the 38th game of Lage’s time. It was the 39th match against Porto, where the poor results really came in. Interestingly, after these four matches, Benfica outshot their opponents but turned 129 shots into just nine goals while conceding 11 goals from 43 attempts.
Without more in-depth data, it’s not easy to paint a complete picture of what exactly happened at the end of Lage’s reign. Were the first 38 games were a fluke and the last 10 a regression to the mean? Or whether the last-10 matches saw his side hit with some incredible bad luck.
My gut says that it’s probably a mixture of the two. The data from the first 38 games were absolutely exceptional, far better than any manager could realistically hope to achieve consistently. But 38 matches, 3,420 minutes of football, is an awfully long time to be lucky for. He must have been doing something right and then hit a bit of bad luck towards the end.
I guess this raises a question that isn’t exactly data-led. Is Lage an outstanding fair-weather manager who then struggles to turn things around when things go wrong?
But, overall, I am a lot happier than I was when I started this analysis.