Analytic Review of 2020/21 - Part 2: Nuno in the Premier
This time, we are looking at how the data compares to Nuno's first two years in the Premier League

The first part of the WolvesAnalytics review of the season focused on the overall trends. It can broadly be summed up like this:
There is not much more to say than, 1) we didn’t create enough chances, 2) we didn’t score enough of the chances that we did create, and 3) we conceded more chances than previously, and 4) we gave up too many goals from those chances.
I’m sure you will agree that scoring fewer goals than you’d like, and conceding more, is not an ideal situation.
This second part is going to look at how our data this season compare to previous seasons.
First up, let’s look at how our results compared to the same teams last season:
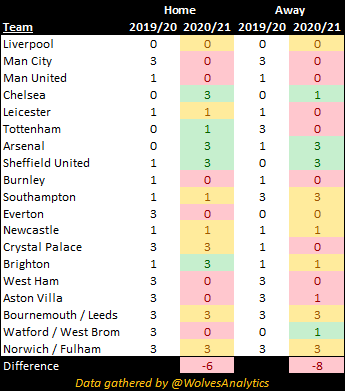
As can be seen, the opposition where we improved our results were the teams who finished in the European places in 2019/20, most notably at home. We can see the improvements of West Ham and Aston Villa this season - the 10 points dropped from season to season accounts for a significant amount of the 14 point swing.
These numbers will use 6-Game Rolling Averages. So all the points on the graph will be the average of the previous six matches.
Pace in Attack?
We can see this more clearly if we look at goals scored. In 2018/19, it took until the second half of the season for us to really click upfront, as we moved to a 5-3-2 formation. Then, in 2019/20, our goalscoring was consistently around 1.5 goals per match until the last third of the season. But in 2020/21, we never really got above one goal per game - and as one goal roughly equals one point, that’s the lower half of the league stuff.

If you don’t shoot, you don’t score. We can see that the number of shots taken was actually pretty consistent throughout the season; it was certainly more consistent than in previous seasons:
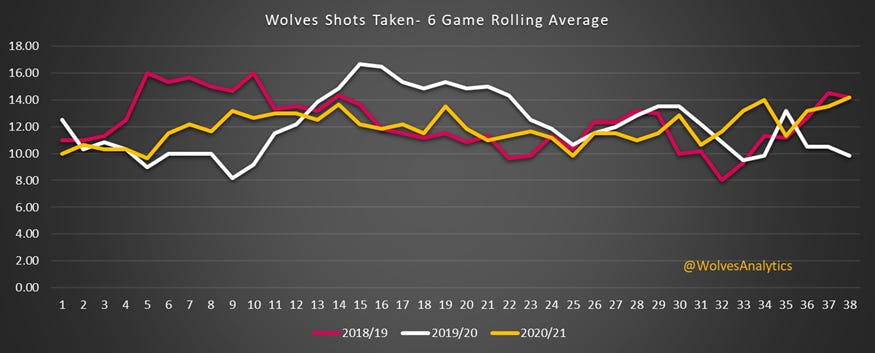
We actually took more shots in 2020/21 (462) than 2019/20 (453), but not as many as in 2018/19 (470). The significant issue was in the quality of these shots:

While we took a fair amount of shots, they were of a low quality. Each shot in 2020/21 was worth 0.08 NPxG, down from 0.1 NPxG over the previous two seasons. Those numbers may not sound like there is much of a difference, but it essentially means that we were 20% less likely to score each chance in 2020/21 compared to 2018/19 and 2019/20. And if you are taking around 450 shots a season, that gap really starts to add up.
Of course, goals are not always scored from good chances. We’ve seen teams struggle as much through trying to walk the ball into the goal as shooting too often from distance. Ultimately, taking 20 shots each with a 5% chance of scoring is mathematically equivalent to taking two with a 50% chance of a goal. But, we didn’t manage to balance that out - over the course of the season, we created 37 non-penalty goals worth of chances, down on 44 and 47 from the previous two seasons.
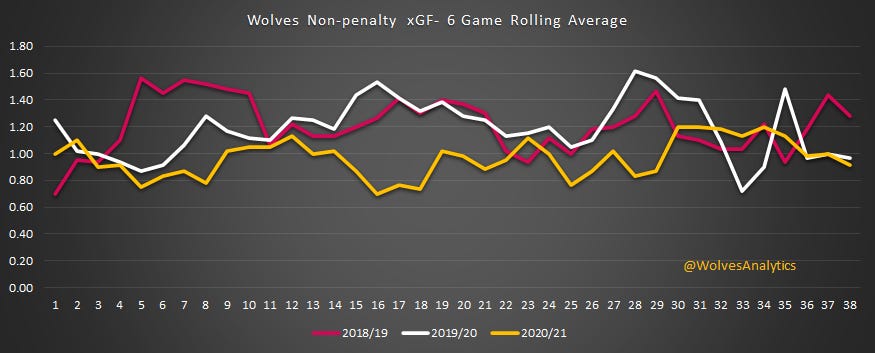
Again, our non-penalty expected goals per match were relatively consistent this season, but at 0.97 NPxG per match, that was quite a bit below 2019/20 (1.16 NPxG) and 2018/19 (1.24 NPxG).
In fact, our finishing was quite good. As explained in Part 1, expected goals looks at the likelihood of a goal being scored as the ball is struck - is it a clear header from inside the 6-yard box, or a volley from 25-yards through a crowded penalty area? Post-shot expected goals look at the actual shot's quality - is it flying towards the top corner or dribbling straight at the keeper. So, if we compare the two of them, we can start to consider the quality of our finishing:
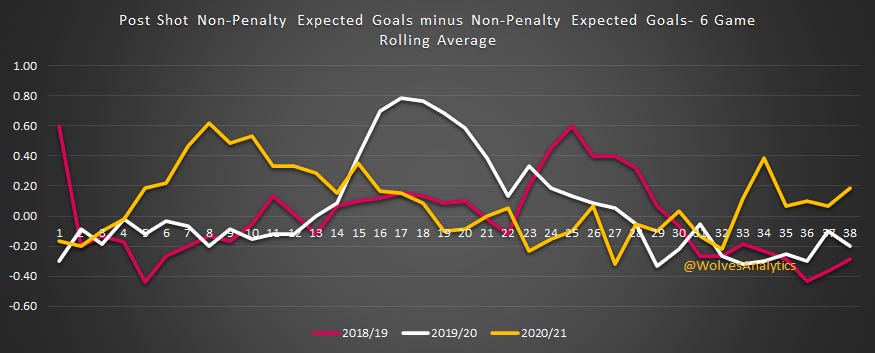
As we can see, our strikers were turning relatively poor chances into good shots for much of the season. We created 39.9 goals worth of shot opportunities but managed to convert these into 43.4 goals worth of shot quality. We only scored 36 actual goals, perhaps suggesting a little bit of misfortune or facing some top quality goalkeeping.
Five at the Back?
What about defensively?
So, as you know, we conceded more goals (52) in 2020/21 than in either of the previous two seasons (46 and 40).

This was a lot more up and down this season. We didn’t keep a clean sheet in 12 games from across November, December and the first three matches in February. We averaged 1.75 goals against per match during this period, culminating in *that* match against West Brom. That was the first really long period we had since promotion where we were conceding goals for fun. After that, Nuno took a more pragmatic approach to ease us away from the relegation zone. We conceded only four goals in the next seven games before being thumped by Man City.
This was the only real period this season where our defence was on the level of previous seasons. In 2018/19, our defence started really well, but we started giving up chances as the attack developed. In 2019/20, it was the opposite - the defence started poorly but improved as the season went on. This past season, it was relatively poor throughout.

Interestingly (or not, depending on your point of view), we gave up far more shots this season (436) compared to last season (393), but far fewer than 2018/19 (457)

This discrepancy is partly because of the number of goals we conceded per shot. We conceded a goal every 9.5 shots this season, compared to 10.4 and 11.0 shots per goal conceded in the previous two seasons. Again, these numbers sound small but add up when you give up 400-450 shots a season.

Putting it all together
So let us first of all look at goal difference:

The critical aspect here for me is how many six-match periods we had a negative goal difference. Aside from a spell in early 2021, we were running a negative goal difference for most of the season.
Our shot difference was actually positive for most of the last season - we were taking more shots than we giving up.

The issue was the quality of those chances:

We were letting the opposition have a better quality of chance than we had throughout the season. We had not done this in the previous two seasons, as we created better goalscoring chances than our opponents. And as mentioned in Part 1, when you don’t have a clinical finisher and your goalkeeper is having a below-average season, that hurts you.
Indeed, we can see the issues in goal in the 2020/21 season, compared to the two previous years:
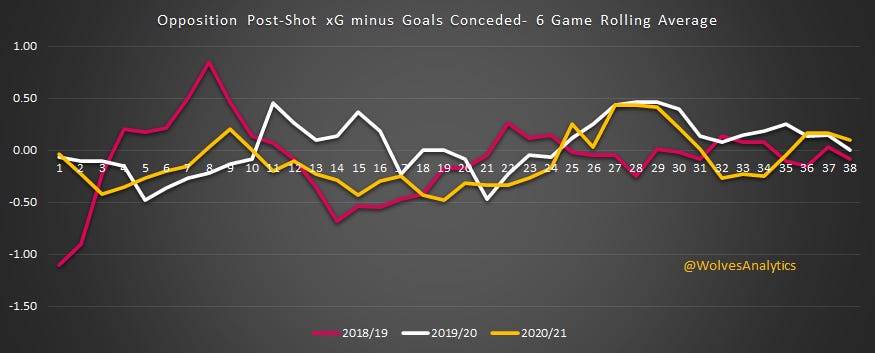
Interestingly, in both 2018/19 and 2020/21, Rui Patrício had a slight dip in his shot-stopping abilities in December. The main difference was that he had an excellent start to the 2018/19 season and then picked up significantly after Christmas. This past season, the slump continued into the New Year.
All of this shows the fine margins between a poor season and a good one. Our base numbers for much of 2020/21 were not much different to the previous two years. Our points per match were relatively consistent throughout the season but did not have any real periods of winning 1.8 - 2 points per game.
